
Data is invaluable to accelerate business development. Data-driven environment detects insight from data helps organizations to create a strong base for increased efficiency and increased revenue.
When it comes to utilizing data, it is better to use an industry-leading business intelligence platform Microsoft Power Bi.
Microsoft Power B, a business intelligence platform and analytics solution, offers strong analytics and reporting capabilities that help organizations understand their complex business data. So, in this scenario, it is better to understand the Power BI and its characteristics.
Please note: When you plan to move forward with Power BI Implementation, get support from reliable power BI consultants.
What is Microsoft Power BI?
Microsoft Power BI transform data and help organizations visualize data analytics and data visualization tools. Power BI seamlessly connects with multiple data sources, including Excel, databases, CRM, and ERP to transform and visualize data.
Interactive dashboards and reports within Power BI bring a combined view of important data points and key metrics. These provide users with immediate understanding of the status of business health and processes
In general, the platform helps improve customer experience, increase sales, overcome market challenges, make informed decisions, and foster stable growth in an evolving environment.
What transformation does Power BI implementation bring to your business?
- Generates insights into various aspects of business operations
- Improves decision-making though actionable insights
- Identify key performance and non-performance areas across finance, sales, customer service, and more.
- Mitigate operational risks earlier before it becomes major
- Share insights across processes to take wiser actions and make improved decisions
- Guide organizations to improve productivity and maximize revenue
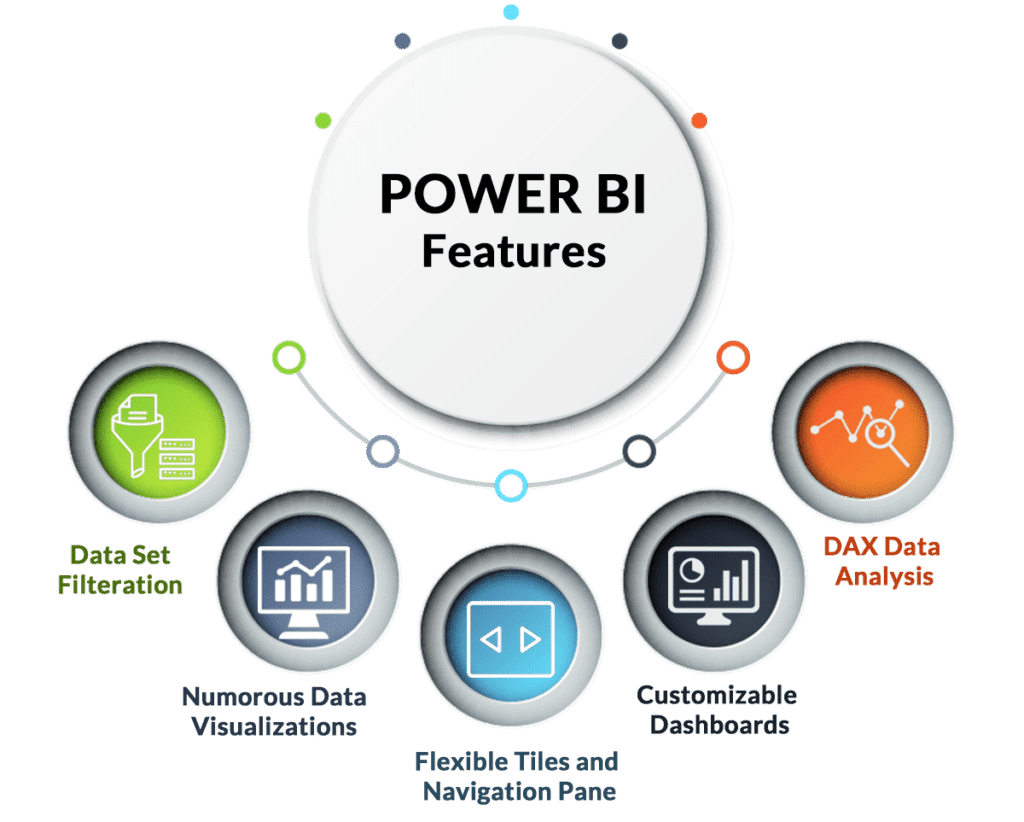
Top Power BI features that every business should aware
Interactive Dashboards and Reports
Users can create interactive Power BI dashboards and reports.
Microsoft Power BI allows users to understand their data through creation of interactive dashboards, reports, and data visualizations – either technical people or non-technical people. Interactive dashboards make it possible for users to easily aware of their data and make informed decisions.
What are Power BI dashboards? A power BI dashboard is a single page, typically a rich interface, where users can attach visuals like charts and graphs from different reports to tell stories using data.
Therefore, users get a high-level overview of important data points, such as sales performance figures, performance metrics, and other relevant business indicators.
How dashboards work?
Power BI offers various features through which users can interact with visualizations. It includes filters, slicers, and drill-through.
- Filters: Allows users to select specific information from a larger data set based on a certain criterion.
- Slicers: Provides a visual way for filtering data by selecting a specific value from a list.
- Drill-through: Allows users to explore data more by clicking on specific data points. This helps users view more granular details related to that point.
Dashboard benefits
- Dashboards presents complex information in an easy understandable way
- Users can explore data for granular details and discover trends and insights
- By interacting with data deeper, dashboards facilitate powerful decision-making by users.
Key features
- Power BI provides various ways to present data, It includes various types of charts, graphs, and other visual elements.
- Filters, slicers and drill-through add more interactivity with data
- Dashboards can be connected with various data sources to provide an integrated view of the status of financial health, sales performance, or customer engagement.
Power BI dashboards are useful in various business scenarios, including:
- Tracking business performance: Tracking key metrics and identifying trends
- Customer analysis: understanding customer behavior, shopping preferences, and identifying interests
- Sales reporting: Analyzing sales data and identifying areas where sales is higher and lower or identifying top performing products.
- Financial Reporting: Provides transparency in the financial process which helps in evaluating performance, identifying financial risks and key areas for improvement.
Power BI reports
Power BI reports present data and insights in a visually appealing way. Reports are multiple pages of data visuals that help users analyze, explore and gain insights from their data in a compelling visual format. It provides interactivity with filters, slicers, and drill-down capabilities to explore data. Reports can be custom created to meet specific business reporting.
- Reports provide a detailed view of data which helps users to dive deep into specific areas.
- Reports allows for more exploration of data than dashboards
- Reports can include various data visualization types, including charts, graphs, and tables.
- Reports can be edited and shared across departments to facilitate data analysis.
Reports and dashboards serve the same purpose of providing data visualizations. While reports allow in-depth data analysis and exploration, dashboards provide a high-level overview of data points and KPI’s.
Integration with Microsoft
Power BI seamlessly integrates with Microsoft platforms which facilitates analysis of more data. Power BI reports can be embedded with Microsoft Teams to enhance collaboration and decision-making.
Natural Language Query
The Q&A feature facilitates data exploration easier by typing questions using natural language. This feature enables users to interact with plain language instead of using SQL query language. The advantage is that even non-technical users can explore data easily and gain insights from their data.
Real-Time Data Streaming
Power BI’s real-time data streaming involves continuous flow of data from data sources for immediate data visualization and analysis. This allows for dashboards and reports to be updated immediately as new data arrives. For example; As soon as a new data is generated whether sales data or customer data, it is instantly reflected in dashboards or reports. What users visualize are the insights from latest data.
Collaboration and Sharing
Power BI allow users to share reports and collaborate with team members which helps organizations empower their decision-making. Users can publish reports to the web, embed them in applications or websites, publish to SharePoint Online, and more.
Power BI Implementation
Power BI is an essential tool in the modern business environment. You have become aware of some of the top features of Power BI. These features are helpful in deeper exploration of your business data and making informed data-driven decisions. So, when it comes to utilizing the powerful business intelligence tool, think of Power BI implementation within your business.
IAX DYNAMICS transform organizations with Microsoft Power BI. No matter how complex your business data is, our Power BI consultants fulfil your data analytics needs with the suitable Power BI version – Power BI Desktop, Power BI Pro, Power BI Premium, or Power BI Fabric.
FAQ Section
What is Microsoft Power BI and why is it important?
Microsoft Power BI transforms raw data into meaningful insight through interactive dashboard and reports. It enables better decisions, improves customer experience, and increases overall commercial performance.
How can Power BI improve business operations?
Power BI creates valuable insights from your data, identifies areas of change, reduces operational risks, and supports data-powered decision making. With a clear approach of major matrix, business can increase efficiency, improve productivity and increase revenue.
What are Power BI dashboards and how do they work?
Power BE dashboard is the single-page visual summary of major commercial data. They use interactive elements such as filters, slices, and drill-through options, allowing users to detect data in real time, track performance and highlight trends in departments such as sale, finance and customer service.
Why should I get support from Power BI consultants for implementation?
Power BI implementation may vary depending on the complexity of your business data and requirements. Experts Power BI Consultants help you choose the correct version (eg, power BI Pro or Premium), ensure spontaneous integration with your current system, and distribute dashboards and reports to suit your goals.